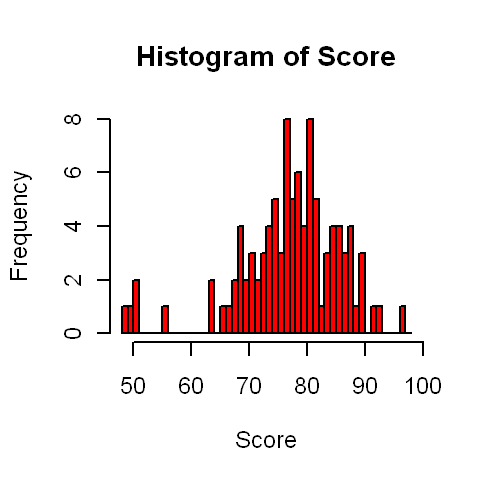
Final scores and grades in course.
Final exam with solutions and comments.
Distribution of grades (includes those not included in spreadsheet
because I didn't have a 5-digit number):
A 11
A- 16
B+ 15
B 11
B- 13
C+ 10
C 6
C- 11
D 3
F 2
(98 students total received a grade)
Older Postings
Review session for final exam: this has now been confirmed as 11:00 am to 12:30 pm, Thursday April 29, in the usual class room (Hanes 120).
Class 29 (Apr 27).
Class 28 (Apr 22).
Class 27 (Apr 20).
Class 26 (Apr 15).
HW 11, due April 22:
9.32, 9.36 (page 440);
10.6, 10.12 (pages 480/481)
Note : In 10.6, don't just take the "95% CI for difference"
and the "Test for difference" as given: show how they were
derived.
HW10, due April 15: questions 8.48, 8.52, 9.14, 9.16 (pages 384 and 426)
Class 24 (Apr 8).
Class 23 (Apr 6).
The final exam is from 8:00-11:00 am on Saturday, May 1. It will take place in the usual class room (Hanes 120) and subject to the same conditions to the two midterms: open book and notes, bring your own blue book and calculator. The material covered will be the whole course. Practice exams are available here and here.
Updated scores (as of April 1).
Midterm 2 with solutions.
Please check your own scores for any errors and let me know if you find any.
If you have not yet given me a 5-digit number, there is still time to do so. You can also obtain your scores in person from me at any time.
|
|
|
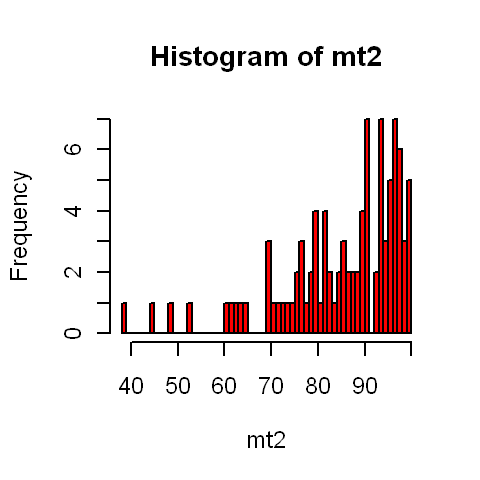
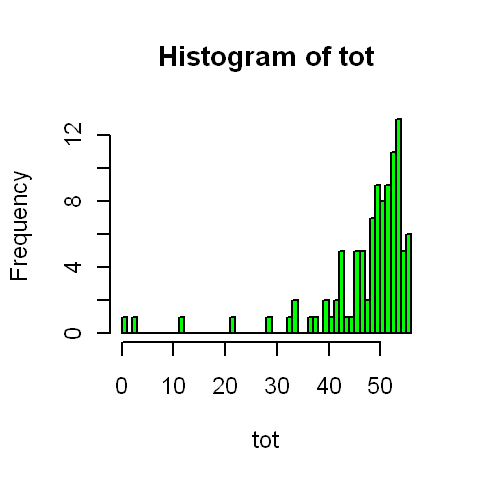
Explanation of "tot". This is your subtotal based on all scores up to Midterm 2. I have taken Midterms 1 and 2 each rescaled to 20 points, and the best 6 out of homeworks 1-8 rescaled to a maximum of 18.75 points. Thus the maximum "tot" score is 58.75.
The final scores in the course will be based on Midterms 1 and 2 (20 points each), the best 8 out of 11 homeworks (25 points), and the final exam (35 points).
Summary statistics: five-number summaries.
For midterm 2: (38,79,90,96,100)
For tot: (0,45.6,50.2,52.8,55.9)
HW9, due April 8: questions 8.14, 8.22, 8.32 and 8.38 (pages 372-373 and 383-384)
Class 22 (Apr 1).
Class 21 (Mar 30).
REMINDER: The midterm is Thursday, March 25, in class. Open book exam, same rules as Midterm 1. Bring blue book and calculator. The material to be covered is essentially Chapters 5-7 (probability material).
There is a review session Wednesday evening, 5:00-6:30, in Hanes 120. In addition, I should be around my office from about 1:00 onwards on Wednesday. Please email if you would like to fit a specific appointment.
Midterm 2 will be on Thursday, March 25, in class. The conditions are the same as for Midterm 1: it's an open book exam, and you should being your own blue book and calculator. The material covered in Chapters 5, 6 and 7, as far as we have got. I will give more detailed guidelines about the material to study in Tuesday's class.
A review session has been scheduled for Wednesday evening (March 24), beginning at 5:00 pm. This review has now been confirmed to be in Room 120, same as the regular class.
Practice exams:
MT2 from Fall 2006.
MT2 from Spring 2009.
Homework 8, due 03/25/2010:
Chapter 6 (pages 299-301): 6.36, 6.38, 6.42, 6.44.
Class 18 (Mar 18).
Class 17 (Mar 16).
Homework 7 due 03/18/10:
Chapter 6, questions 6.6, 6.10, 6.26, 6.28
Remark:
6.28 is a follow-on to 6.27. You are not requested to hand in 6.27
as well, but probably you should work through 6.27 for yourself, before
tackling 6.28.
Class 16 (Mar 4).
Class 15 (Mar 2).
MIDTERM 1:
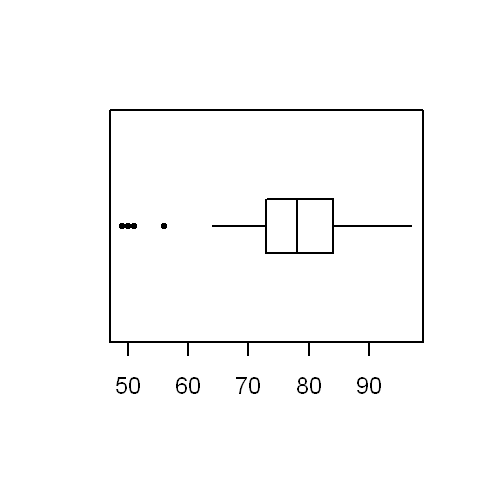
Here are a boxplot and histogram for the total exam scores (mean 77.5, SD 9.0):
| 
|
I also drew a side-by-side boxplot to illustrate the different scores on the two questions:
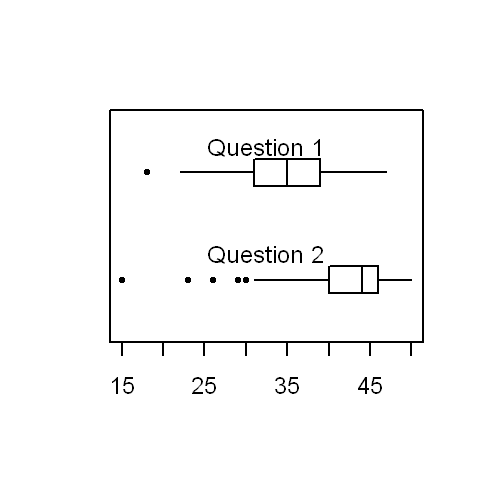
|
Midterm 1 with solutions
Link to the NYT article on Title IX and girls' fitness.
Homework 6, Due March 4 2010: Chapter 5, problems 5.76, 5.80, 5.86, 5.90 (pages 260-262)
For 5.86 and 5.90, you will need to know the definitions of sensitivity and specificity (page 250).
In a diagnostic test, the sensitivity is the probability of a positive test (one that shows the condition being tested for is present) when it really is present.
The specificity is the probability of a negative test when the condition being tested for is absent.
Class notes:
Class 14 (Feb 25).
Class 13 (Feb 23).
Class 11 (Feb 16).
Class 10 (Feb 11).
Homework 5, due February 18:
Question 4.85, page 196
Question 4.86, page 196
Question R1.12, page 207
Question R1.18, page 208
Note.
Question 4.86 asks you to pick out an article from a medical
journal and comment on it. Please include the cover page of the article ,
whether you photocopy it from a journal or print it out from the web.
There's no need to include the whole article - this is mainly to make
sure we can identify the article.
MIDTERM 1:
Midterm 1 will be on Thursday, February 18, in class. It is an open book exam: bring a calculator and blue book. A review session has been scheduled for 6:30 pm on Monday, February 15, in Hanes 120 (the regular classroom).
Link to 2009 Midterm 1
Link to 2006 Midterm 1
Class 9 (Feb 09).
Homework 4, due 02/11/2010. For this homework I'm not following the text, but am using two problems of my own to illustrate the concepts of regression and random sampling respectively. Each question is considered equivalent to two normal HW questions, so the total assignment will count for the same number of points as the other assignments which have consisted of four questions.
Question 1 (regression): Refer to this spreadsheet for the data from the student questionnaire on student heights as well as the question about how much they spent on their last haircut. For convenience, I have edited out those entries for which someone did not state the price of their last haircut (but not the ones where they said their haircut cost $0) and I have also rearranged the entries so that the men appear separate from the women.
I want you to investigate whether someone's height has any influence on how much money they are willing to spend on a haircut. To this end:
(a) Compute a regression in which the Y variable is "Haircut" and the X
variable is "height". What is the regression equation? (Use Excel for
this.)
(b) Suppose someone has a height of 63 inches. Predict how much they
spent on their last haircut.
(c) Calculate the mean and standard deviation of both variables,
and the correlation
coefficient r (again, it's fine to use Excel for these calculations).
(d) Use the formulas given in class (or p. 122 of the text) to show how
to derive the intercept and slope of the regression from the statistics
you calculated in (c). (The answer should match what you found in (a),
but I want to see your working.)
(e) Draw a scatterplot in which the Y variable is "Haircut" and the X
variable is "height". Then add in the trend line BY HAND. (For the
scatterplot itself, you can either use Excel or draw the points by hand.
However, for the trend line, I want you to do this by hand. This is
intended to give you practice in how to find the trendline if you have to
do it for yourself.)
(f) Now repeat part (a) of this exercise but separating the class into
men and women. (There is no need to go through the rest of the
calculations in (b) through (e) again.) How do the results change?
(g) If you've done this correctly, you should find that the slope of
the whole regression is negative, but when separated into men and women,
each of the single-sex regressions has a positive slope (i.e. taller
people tended to spend more on their haircut than shorter people).
Of what famous statistical paradox is this an example? Give a verbal
explanation of why this occurs.
Question 2 (sampling):
Suppose you were host of a TV show and you wanted to select five members
of the current UNC Women's soccer team to appear on your show. Of these
five, three are to be either freshmen or sophomores, the other two
are to be juniors or seniors. However apart from that condition, the
selection is to be entirely random.
You can find the current roster of the team at
http://tarheelblue.cstv.com/sports/w-soccer/mtt/unc-w-soccer-mtt.html
Describe exactly how you would go about the selection, including the
use of a table of random numbers to ensure that it is truly random.
Then, carry out your procedure and say which five players you would
pick. Make sure that you describe your method carefully enough that the
grader could verify everything if he wanted to.
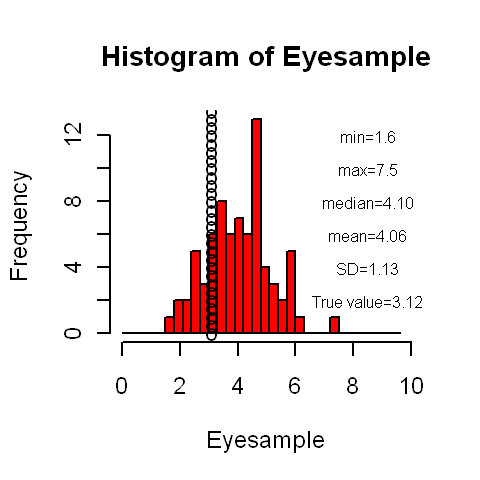
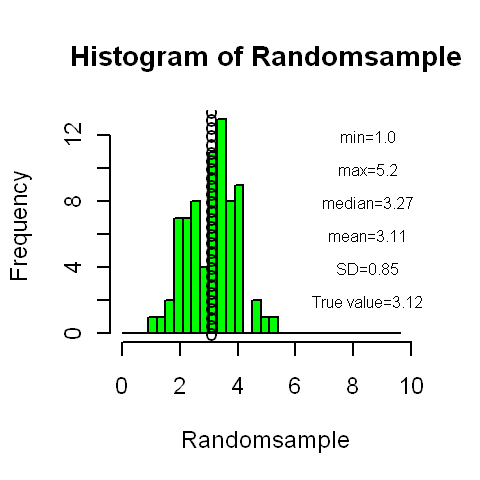
Results of USA sampling exercise.
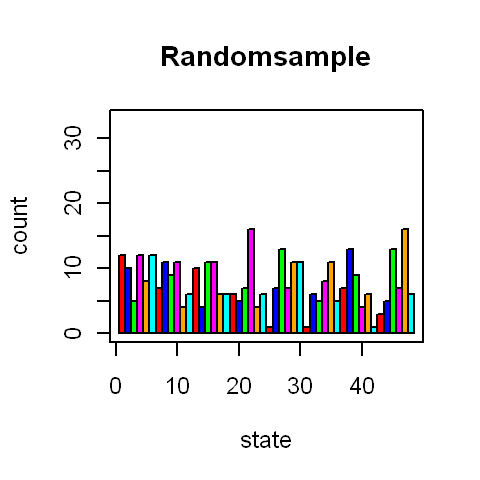
The first picture shows a histogram of estimated areas of the continental USA (in millions of square miles) when the sample of five states was selected by eye. The second picture shows the corresponding histogram when the sample was selected at random. The true area is 3.12. The second sample is closer to the truth when assessed by median (3.27 against 4.10) or mean (3.11 against 4.06), and also have a smaller standard deviation (0.85 against 1.13). In addition, 47 out of 75 respondents (63%) got closer to the true value using the random sample than the eye sample.
| 
|
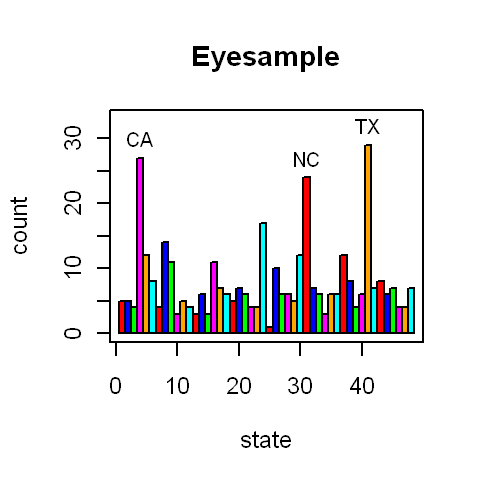
The second pair of figures illustrates the distribution of states by each method of sampling. The eye samples oversample CA, NC and TX. The random samples are much more uniform.
| 
|
The two midterm exams are now definitely scheduled as THURSDAY, FEBRUARY 18 and THURSDAY, MARCH 25 , both open-book exams held in class at the regular time. Further details about the material to be covered will be presented closer to the actual exam.
HW3, due 2/04/10: 2.110, 2.120, 2.128, 3.46
Note: question 2.128 asks you to download some data on baseball home runs from the course CD, and use the techniques of this course to determine which one was the best. Obviously there is no unique correct answer to this question and you should feel free to express your personal opinion regarding which characteristics you feel most important. However, what is important is that you back up your opinion by using appropriate statistical techniques. The question will be graded not by which player you select, but how well you back up your answer with suitable statistics.
Baseball example (for use in next class, not the
same as in the HW problem).
Class 5 (Jan 26).
Exercises in Excel (for use in classroom demo).
Charleston and Mount Airy Temperatures
(dataset used in above demo).
Midterm 1 is now definitely scheduled for Thursday, February 18. Following the poll in today's class, midterm 2 is now scheduled for Thursday, March 25. However, as a last chance, please check your diary and let me know if there is any reason why you would be unavailable to attend class on March 25. My intention is to confirm this definitely in Tuesday's class.
Homework 2, due 1/28/09:
Chapter 2, question 2.22 (page 47), 2.94, 2.96, 2.108 (pages 83-85).
Notes:
Question 2.22 asks you to use software based on the "sugar" data on the CD (amount of sugar in popular brands of cereal). You should all have the book and hence the CD by now, but in case anyone has a problem with that, I append the data below. You do not have to use software - I will accept freehand sketches - but I encourage you to explore the use of Excel at least for the histogram part of this. If you are familiar with other types of software for producing these graphs, that's OK as well (but in that case, please specify what software you used).
The data: 7 5 14 12 1 13 2 12 10 3 11 13 3 10 11 6 10 15 3 3
In question 2.94(c), whichever of the eight descriptive methods you recommend, you should calculate or draw the relevant descriptive statistics (in other words, don't just say which method you would use, you should do it as well).
Question 2.108 asks about mean and standard deviation. It's not sufficient to answer this question that you enter the numbers in your calculator or in Excel and just quote the answer. I want to see the actual working, like the example on page 60. However, you are allowed to use a calculator or Excel to help you.
Here is the in-class questionnaire and responses (updated 01/21/10). Also click here for a second spreadsheet comparing the political party affiliations of the class in 2009 and 2010.
Homework 1, due Thursday January 21: Chapter 1, questions 1.24, 1.33. Chapter 2, questions 2.6, 2.8.
Note: Question 1.33 essentially asks you to find a newspaper article of your own choosing that uses statistics, and describe briefly the type of statistical reasoning it involves. You can include a physical cutting from a newspaper, or a photocopy, or a printout from a news website such as www.newsobserver.com, www.nytimes.com, www.usatoday.com or www.cnn.com. If the article is too long to include the whole thing, just hand in the part that refers to statistics. However, I do want everyone to hand in the article as well as your own commentary about it! (The commentary, however, need be no more than a couple of sentences.)
Class 2 (Jan 14).
Class 1 (Jan 12).
Introductory Class Handout (Jan 12).
LINKS
Steven Strogatz on probability. (Apr 27)
Health risks of estrogen supplements. (Apr 20)
Cherry juice and marathon running. (Apr 06)
New York Times report on statins and cholesterol reduction. (Apr 01)
New York Times report on IVF and birth defects. (Feb 25)
New York Times report on childhood obesity and premature death. (Feb 11)
New York Times report on abstinence-only sex education. (Feb 03)
USA Today report on "too much sitting is bad for your health". (Feb 01)
News and Observer report on cellphones and distracted driving. (Jan 14)
New York Times report on obesity trends. (Jan 14)
Boston Globe report on senate election (and other stuff). (Jan 14)
Webpage from Spring 2009.
If you have any questions, feel free to email me (rls at email.unc.edu)
Return to Richard Smith's page