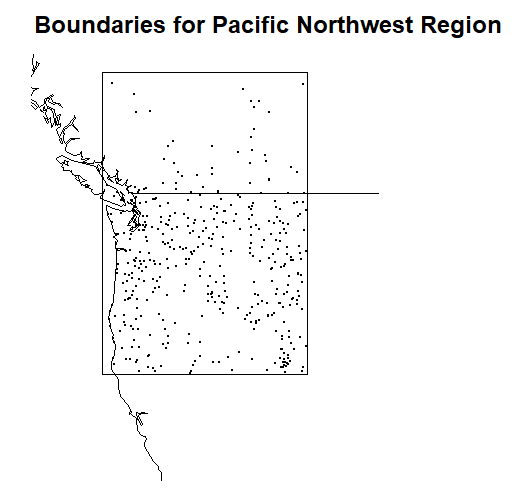


Station Data. This file contains summer (JJA) maxima of daily temperature maxima from 432 stations 1950-2021. Stations considered for inclusion had latitudes between 40 and 55 degrees north, longitudes between 110 and 125 degrees west. For each station and year, the summer maximum is computed if at least 90% of the potentially 92 datapoints are available; if not, it is NA. A station is included if at least 54 (75%) of the 72 possible summer maxima are available. Column 1 is the file name as recorded in database for the Global Historical Climatological Network; for example, the first station in the database has file name CA001012040; link to GHCN is "https://www.ncei.noaa.gov/data/global-historical-climatology-network-daily/access/CA001012040.csv". Column 2 of the file is the name of the station; columns 3 and 4 are the longitude and latitude; the remaining columns are annual maxima from 1950-2021, missing values being denoted by NA.
Annual maximum temperatures in Kelowna, BC. Derived from this website. The daily maximum temperatures are here. Note that the daily temperatures are missing from 2/9/1993 to 4/7/1993 when the station was moved approximately half a kilometer.
Regional Mean Anomalies. This is derived from the "HadCRUT" series of gridded temperature anomalies; the latest version may be downloaded from "https://crudata.uea.ac.uk/cru/data/temperature/HadCRUT.5.0.1.0.analysis.anomalies.ensemble_mean.nc" (netcdf file; use R package ncdf4 to read). The overall HadCRUT5 dataset consists of gridded 5 degree by 5 degrees monthly temperature means for all months back to 1850. For this series of regional summer means, temperatures were averages over the summer months (JJA) for each year, and grid cells defined by the same boundaries as the station data. The result is an annual series from 1850 to 2021 (some early values are "NA").
Model Data: ssp585. - Model Data: ssp245. - Model Data: ssp126. These data are from the CMIP6 climate modeling experiment downloaded from the Copernicus website. Monthly data from 17 climate models were downloaded as netcdf files and regridded to calculate the mean summer temperature (average of tasmax and tasmin for June, July, August) for latitudes between 40 and 55 degrees north, longitudes between 110 and 125 degrees west, for each year from 1850 to 2100 (historical data up to 2014, sspXXX from 2015 to 2100, where XXX is one of 585, 245, 126). Plots of the data are shown below. The superimposed blue curve is the mean of the 17 climate models, smoothed by natural splines with 6DF. The red curve is the observed regional mean for the years available. All data are expressed as anomalies from the years 1961-1990.
|
|
|
|

| 
| 
|
Return to Richard Smith's page